Observability overview
All self-hosted Instabase deployments are equipped with observability tools that measure and provide visibility into the internal state of the deployment’s infrastructure and applications. This includes measuring aspects of:
-
Infrastructure and application traffic, including request and error rates.
-
Performance, including latencies.
-
Specific internal states, such as worker count in Celery.
-
Saturation of CPU, memory, file system, or open connection handles.
With the Instabase observability toolset, you have access to a broad range of observability-related information, including statistics, logs, usage metrics, traces, and real-time container insights.
Architecture
The Instabase observability stack is made of common open-source packages and integrates with standard tooling commonly used in administering Kubernetes clusters. The following diagram provides an overview of a self-hosted deployment’s observability stack:
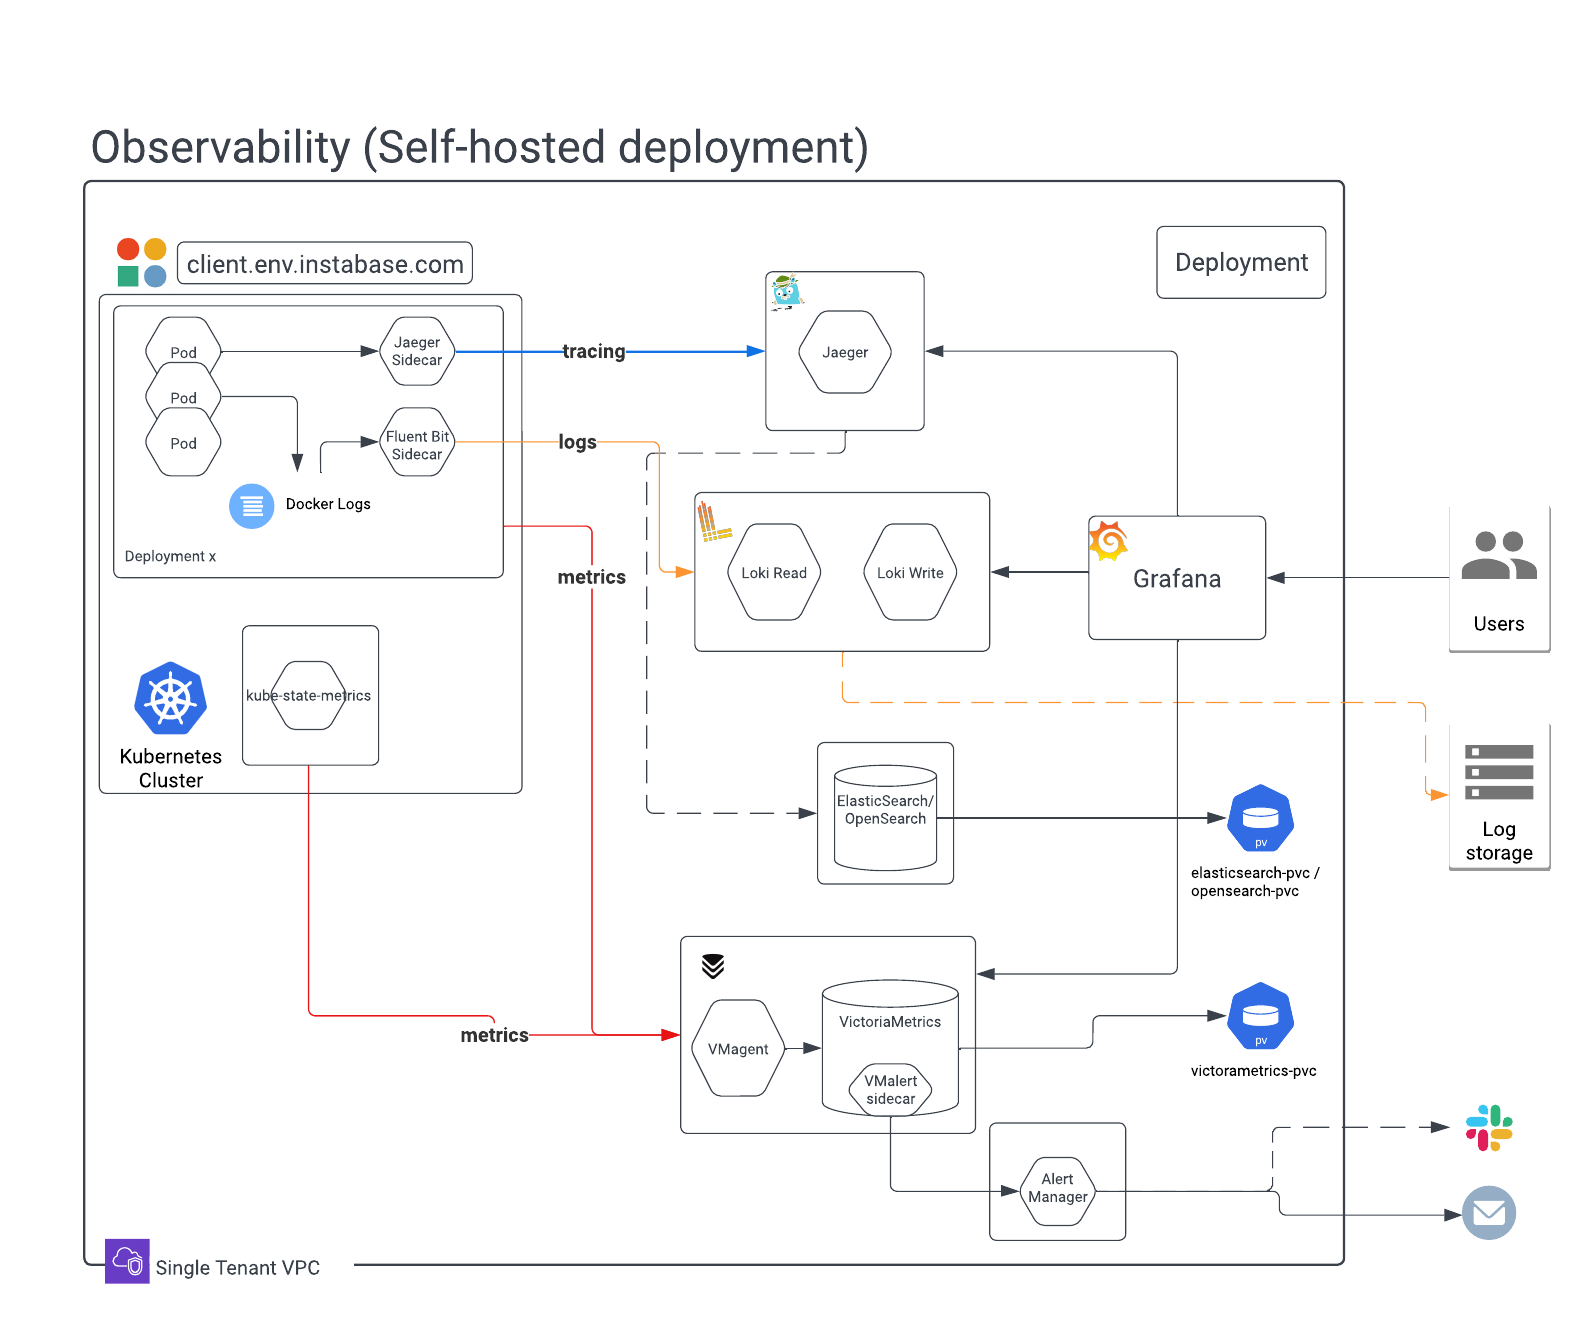
In more detail, the stack comprises the following components:
| Component | Description |
|---|---|
| Grafana | Grafana is an open-source, interactive visualization application. It’s used to present dashboards of various statistics, metrics, and system health indicators. |
| VMAgent | VMAgent is used for collecting statistics data from various sources. Collected data is represented as time series data, with attributes and labels, and is written to VictoriaMetrics for long-term storage. |
| VictoriaMetrics | VictoriaMetrics is a time series database that provides the backing store for VMAgent and Grafana. Data is presented in Grafana by querying VictoriaMetrics. VictoriaMetrics requires a persistent volume claim (PVC) to be configured as part of the landing zone for storage of the database files. See infrastructure requirements for details. |
| Alertmanager | Alertmanager is a service that integrates with Grafana and VictoriaMetrics to process and deliver alerts to external services such as email, Slack, or OpsGenie. You can configure alert forwarding. |
| Fluent Bit | Fluent Bit provides log forwarding from individual pods. Each container inside the Instabase services pod writes logs to disk (emptyDir). The disk volume is mounted to the Fluent Bit container running inside the same pod. A Fluent Bit sidecar then collects all log files written by Instabase services on the mounted volume and forwards them to Loki. The sidecar also performs log rotation over the log files created by Instabase services. |
| Loki | Grafana Loki is responsible for aggregating, indexing, and storing log information. Loki also provides a powerful query language, LogQL, to query logs. Loki aggregates logs collected by the Fluent Bit sidecars and uses the configured storage location for long-term retention of logs. |
| Jaeger | Jaeger is a distributed tracing platform used to trace the flow of services across the Instabase platform. This includes both infrastructure and flow details. |
| kube-state-metrics | kube-state-metrics is a service that listens to the Kubernetes API server and generates metrics about the state of the cluster. These metrics are scraped by VMAgent and written to VictoriaMetrics. |
| OpenSearch | OpenSearch is a search tool that provides indexes for many of the observability components. OpenSearch requires a persistent volume claim (PVC) to be configured as part of the landing zone for storage of indices. See infrastructure requirements for details. |
Tooling
You can use several tools to access your deployment’s observability data.
-
Grafana visualizes statistics in a dashboard format, providing insights into system stats, service health, error rates, and more. You can use Grafana to search and analyze logs. You can also access Jaeger traces from Grafana, helping you analyze request-level data across services and routines. Grafana is accessible by URL (<YOUR_INSTABASE_BASE_URL>/grafana) or directly from the Instabase All Apps view.
-
Deployment Manager lets you understand a deployment’s Kubernetes infrastructure. From the Infra dashboard tab you can access real-time and historical information such as usage metrics at the deployment or pod level. Container insights also provide real-time configuration information for running containers. Also in Deployment Manager, you can use the Logs tab to retrieve logs for specific services from a given time period.
-
Telescope, also available in Deployment Manager, is a tool that lets you export telemetry data, such as logs, stats, and metrics, for various services in a deployment from a specified time range.
SaaS deployments don’t have access to Grafana or Deployment Manager, including the Telescope tab in Deployment Manager.
In addition to this tooling integrated into Instabase, you can use standard Kubernetes tools like the kubectl command line tool to query the same information.
Observability requirements
System, storage, and access requirements support statistics collection, federated cluster statistics collection, and log aggregation.
Statistics collection
To support statistics collection, the following system and access requirements must be met.
System requirements
-
Compute and memory: Allocate approximately 3.5 cores and approximately 8 GB RAM for a typical setup. This can change based on the deployment size and the number of monitored workloads.
-
Persistent Volume: We recommend at least 128 GB and ideally 512 GB for durable statistics storage, used for storing and querying historical statistics data.
Access requirements
The access requirements here are subject to change and are provided for reference. The most up-to-date requirements are available in your release bundle (installation.zip). You can find the ServiceAccount, Role, and RoleBinding requirements in the monitoring.yml file, available in the additional_configs folder.
When applying the following .yml files, be sure to update the namespace: <IB_NAMESPACE> value with the namespace where Instabase workloads are run.
- Instabase requires access to the namespace to apply various Kubernetes objects such as Roles, RoleBinding, Deployments, StatefulSets, Services, and ConfigMaps. This requires a ServiceAccount named
monitoring.
apiVersion: v1
kind: ServiceAccount
metadata:
  name: monitoring
  namespace: <IB_NAMESPACE>
- The kube-state-metrics app needs the following Role and RoleBinding access in order to read Kubernetes object states:
apiVersion: rbac.authorization.k8s.io/v1
kind: Role
metadata:
  labels:
    app: kube-state-metrics
  name: instabase-kube-state-metrics
  namespace: <IB_NAMESPACE>
rules:
  - apiGroups: [""]
    resources:
      - configmaps
      - endpoints
      - limitranges
      - persistentvolumeclaims
      - pods
      - replicationcontrollers
      - secrets
      - resourcequotas
      - services
    verbs: ["list", "watch"]

  - apiGroups: ["batch"]
    resources:
      - cronjobs
      - jobs
    verbs: ["list", "watch"]

  - apiGroups: ["extensions", "apps"]
    resources:
      - deployments
    verbs: ["list", "watch"]

  - apiGroups: ["autoscaling"]
    resources:
      - horizontalpodautoscalers
    verbs: ["list", "watch"]

  - apiGroups: ["extensions", "networking.k8s.io"]
    resources:
      - ingresses
    verbs: ["list", "watch"]

  - apiGroups: ["networking.k8s.io"]
    resources:
      - networkpolicies
    verbs: ["list", "watch"]

  - apiGroups: ["extensions", "apps"]
    resources:
      - replicasets
    verbs: ["list", "watch"]

  - apiGroups: ["apps"]
    resources:
      - statefulsets
    verbs: ["list", "watch"]

---
apiVersion: rbac.authorization.k8s.io/v1
kind: RoleBinding
metadata:
  labels:
    app: kube-state-metrics
  name: rolebinding-instabase-kube-state-metrics
  namespace: <IB_NAMESPACE>
roleRef:
  apiGroup: rbac.authorization.k8s.io
  kind: Role
  name: instabase-kube-state-metrics
subjects:
  - kind: ServiceAccount
    name: monitoring
    namespace: <IB_NAMESPACE>
- To enable service discovery, IB-Prometheus makes HTTP (GET) calls to the Kubernetes api-server, using the following files mounted in the pod for authentication:
/var/run/secrets/kubernetes.io/serviceaccount/namespace
/var/run/secrets/kubernetes.io/serviceaccount/token
/var/run/secrets/kubernetes.io/serviceaccount/ca.crt
Federated cluster statistics collection
If you have Prometheus cluster monitoring enabled, you can optionally federate with the cluster statistics infrastructure to collect and display CPU and memory utilization data in Deployment Manager. This lets you view cluster-level data in the same place as deployment-level data.
Prometheus cluster monitoring is typically deployed as part of the cluster and managed independently from the observability stack provided with Instabase. If a cluster platform Prometheus is not present, but you’d like to enable federated cluster statistics collection, you can contact Instabase Support for assistance. See the Prometheus federation documentation for additional information.
To enable federated cluster statistics collection, you need:
-
A Prometheus cluster agent.
-
The Prometheus server target for federated metrics. For example,
source-prometheus:9090. See observability configuration for implementation details.
Log aggregation
To support log aggregation and storage, the following system, storage, and access requirements must be met.
System requirements
-
Fluent Bit: Each Fluent Bit sidecar uses an additional 30 millicores and 35 MB of RAM, which must be factored into CPU and memory resource calculations.
-
Loki: Grafana Loki has two types of replicas: read and write. Read replicas serve read queries and write replicas accept the streams of logs coming from Fluent Bit. We recommend running 2 pods of read replicas and 2 pods of write replicas (4 pods total). This setup requires the allocation of approximately 2 cores of CPU and 2 GB of RAM.
Storage requirements
Cloud storage shared between all Loki replicas is required. By default, 14 days’ worth of logs are stored at a time, but this can be configured. The following cloud storage options are supported:
-
Amazon S3 bucket. To enable access, you must create a secret named
aws-access-keywith values foraccess-key(your AWS IAM key) andsecret-access-key(your AWS IAM secret key). -
Azure Blob storage container. To enable access, you must create a storage account access key for the container.
-
Network File System (NFS) volume. Approximately 64 GB of space is required for log storage in your NFS volume.
-
Google Cloud Storage bucket.
See observability configuration for implementation details.
Access requirements
To attach metadata to logs, the Fluent Bit sidecar makes calls to the Kubernetes API server to get pod-related information. Querying the Kubernetes API server is a one-time operation that happens during pod startup.
The following Role and RoleBinding access must be granted to the Kubernetes service account that runs Instabase services.
apiVersion: rbac.authorization.k8s.io/v1
kind: Role
metadata:
  name: instabase-log-aggregation
  namespace: <IB_NAMESPACE>
rules:
- apiGroups: [""]
  resources: ["pods"]
  verbs: ["get"]

---

apiVersion: rbac.authorization.k8s.io/v1
kind: RoleBinding
metadata:
  name: rolebinding-instabase-log-aggregation
  namespace: <IB_NAMESPACE>
subjects:
  - kind: ServiceAccount
    name: default
roleRef:
  apiGroup: rbac.authorization.k8s.io
  kind: Role
  name: instabase-log-aggregation